L.I: To plan and carry out statistical investigations
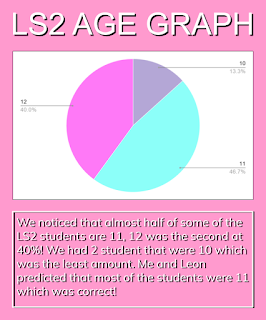
For our activity we had to create a graph on a topic. Azatulah and I went around our class to find 15 different people. We asked them how old they were. The results were that there were 2 people out of 15 were 10, 7 people out of 15 were 11 and 6 people out of 15 were 12.
After gathering out data were created. We used a pie chart to find our results. We noticed that almost half of some of the LS2 students are 11, 12 was the second at 40%! We had 2 student that were 10 which was the least amount. Me and Leon predicted that most of the students were 11 which was correct!

No comments:
Post a Comment
Note: only a member of this blog may post a comment.